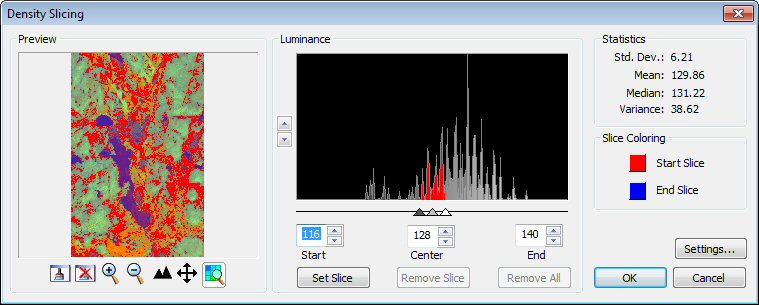
| Preview |
The Preview pane provides visual feedback on the selected image by applying a highlight to all pixels included in the range. A set of controls allow you to explore the preview (Zoom In, Zoom Out, Pan, Fit, Update Preview, Update View and Restore View).
|
| Luminance |
Displays the luminance histogram with a vertical scale that you can set. The display of the histogram is a representation of the number of pixels having each of the 256 possible values, from 0 to 255.
The Sliders are used to comprise in that range on the required values. All the pixels (values) comprised in that range are highlighted on the image.
The Up/Down controls at the left of the graph are used to adjust the Vertical Scale of the histogram. The Sliders and text boxes are used to position the start and end points of the range. The Center Slider is used to move the ranger across the histogram.
The double-click action can be used in the histogram graph area and has two purposes:
-
When used on an existing slice, it activates the Slice Editing mode.
-
When used in an empty space, it activates the Slice Create mode.
The single-click action can be used in the histogram graph area and has one purpose:
-
When used on an existing slice, it activates the Remove Slice Mode.
-
When used in an empty space, nothing happens.
|
Slice Editing mode
|
Slice Create mode
|
Remove Slice Mode
|
|
When in this mode, the double-clicked slice:
1. Becomes the Active Slice.
2. The sliders are repositioned to the values of the Active Slice.
3. The colors of the Active Slice are removed from the histogram and replaced by the highlight color.
4. The colors from the Slice Coloring group are set to the ones used by the Active Slice.
5. The colors displayed on the image by the Preview option are taken from the Slice coloring group box active colors.
|
This mode is activated when there is a double-click in the graph area not occupied by a slice –that is, on a space.
When in this mode, the double-clicked space:
1. Becomes the Active Space.
2. The sliders are repositioned to the limits of the Active Space.
3. The highlight color is activated using the Active Space slider position.
|
When in this mode, the clicked slice:
1. Becomes the Active Slice – highlighted borders.
2. The Remove Slice button is enabled.
3. The Sliders remain at their current position, they are not moved.
|
|
At this point, the user can:
1. Expand, retract or move the Active Slice.
2. Set new colors.
3. Use the set slice button.
|
At this point, the user can:
1. Expand, retract or move the Active Space
2. Set new colors
3. Use the Set Slice button.
|
At this point, the user can:
1. Click on the Remove Slice button
2. Expand, retract or move the sliders.
i.At this point, the Slice is deselected.
ii.The Remove Slice button is disabled.
3.Set new colors.
i. At this point, the Slice is deselected.
ii. The Remove Slice button is disabled.
4.Use the Set Slice button.
i. At this point, the Slice is deselected.
ii. The Remove Slice button is disabled.
5. Use the Double-Click Action.
|
|
| Set Slice |
The Set Slice button applies the current slice coloring to the selected range. The histogram area affected by the range is colored accordingly. The slice is recorded for selecting and editing operations.
|
| Remove Slice |
When an existing slice is selected (clicked on), it becomes the active slice and the Remove Slice button is enabled. Clicking on the Remove Slice button deletes the slice and redisplays the image to the new state.
|
| Remove All |
The Remove All button clears all active slices, resets the sliders and the Start, Center and End Slice colors to their default value.
|
| Statistics |
The Statistics group box displays statistical information about the pixels comprised in the range.
-
Standard Deviation
-
Mean
-
Median
-
Variance
|
| Slice Coloring |
Allows you to set the color for the start range and the end range.
|
| Start Slice |
The Start Slice color icon is used to show the active color and to pick a new one. Clicking the color icon opens the standard MicroStation color selector where you can choose a color.
|
| End Slice |
The End Slice color icon is used to show the active color and to pick a new one. Clicking the color icon opens the standard MicroStation color selector where you can choose a color.
|
| Settings |
Selecting this option opens the Histogram tab in the Descartes Settings dialog box allowing you to set the Hilite Color.
|
| OK |
Click OK to apply the slice coloring to the image and exit the Density Slicing dialog.
|
| Cancel |
The Cancel button closes the Density Slicing dialog and resets the values to their default. No changes are applied to the image.
|